What Does It Take to Say "Individual Identification Works"? — Scores and Thresholds in Tagless Individual Identification
In this post, we tackle a single question: how can you actually verify that an object can be individually identified?
GAZIRU.z (Individual Identification) is a remarkable product that identifies individual items from images alone — no tag required. But what the product itself actually does is return a list of scores that represent how similar the queried image is to each registered image. How those scores are interpreted is something the system on the receiving end has to design and implement, case by case.
How should those scores be interpreted? At what point can you say identification is working? These are the questions you inevitably hit when introducing individual identification into a real system. The difficulty changes with the material, the shape, and the imaging conditions. You might expect the answer to be "you won't know until you try" — but in fact, there is a way to evaluate this in advance. It's the technique of analyzing score distributions.
How Identification Decisions Are Made — Scores and Thresholds
The score returned by GAZIRU.z is a value between 0 and 1: the closer to 1, the higher the similarity.
To decide that two images are of the same individual, we check whether the score exceeds a pre-defined threshold.
score ≥ threshold → judged as same individual
score < threshold → judged as different individuals
The mechanism itself is simple. But that raises one big question: how do you set this threshold?
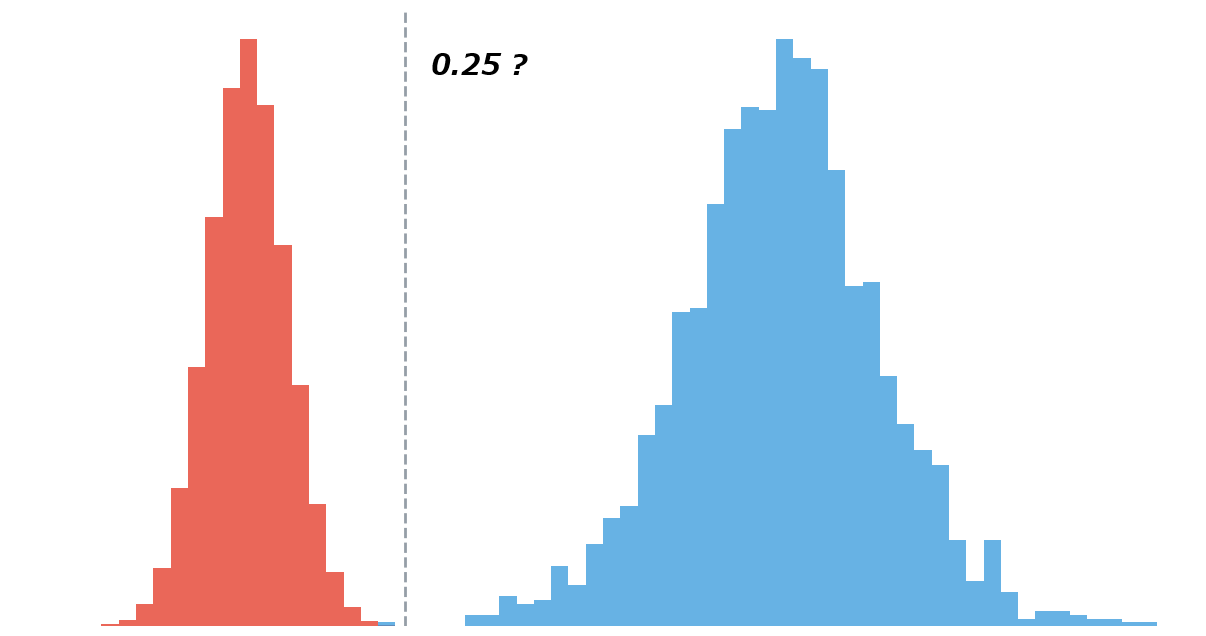
"A Same-Individual Pair Scored 0.3... Is That Bad?"
Before going further, let's clear up one possible misunderstanding. Suppose a same-individual pair returns a score of, say, 0.3. At first glance that may sound low — but as we'll see, this is actually a score range where individual identification is very likely to be feasible.
Just as importantly, though, the strict truth is this: the score value itself has no absolute meaning.
Hearing only "the score was 0.4" tells you nothing about whether it's a "good" score or a "bad" one. That's because the entire score range shifts depending on the material and imaging conditions. For one object, same-individual scores might cluster around 0.3; for another, around 0.5. The same value of "0.4" could correspond to a same-individual pair for one object and a different-individual pair for another.
So how do we decide? The answer is: look at the distribution.
How to Verify — Building Two Kinds of Score Distributions
Before going into production, we visualize the score distribution for each new object using the following procedure:
- Capture the registration images of the verification targets and register them
- Capture the query images of the verification targets, using equipment and conditions close to actual operation
- Match every possible image-pair combination and collect the scores
- Plot two separate histograms, one for same-individual-pair scores and one for different-individual-pair scores (x-axis: score, y-axis: number of pairs that landed at that score)
This gives you two distributions with very different characteristics: the same-individual-pair distribution and the different-individual-pair distribution. Imaging variation and individual-to-individual variation are generally random, so the more samples you collect, the closer each distribution becomes to a normal distribution.
In practice you'd run this verification with hundreds to thousands of individuals, but to get the idea across, let's walk through it with just five individuals: A, B, C, D, E.
- Capture the registration images and register them → You register five images A, B, C, D, E.
- Capture the query images, using equipment and conditions close to actual operation → You capture query images A', B', C', D', E', using the same equipment and conditions you'll use in production.
- Match every possible image-pair combination and collect the scores → For example, matching A' against all individuals registered in step 1 gives you one same-individual-pair score (A'-A) and four different-individual-pair scores (A'-B, A'-C, A'-D, A'-E). Repeating this for B', C', and so on yields 5 same-individual-pair scores and 20 different-individual-pair scores in total.
- Plot two separate histograms, one for same-individual-pair scores and one for different-individual-pair scores → Looking at these two distributions tells you whether individual identification is feasible.
The critical point here is step 2: "using equipment and conditions close to actual operation". If you verify with samples captured more carefully than your actual operation will allow, the distribution you see will be more optimistic than the system's true field performance — and you may only discover identification is infeasible after rolling out. The verification capture should reproduce real-world operating conditions as faithfully as possible.
What Distributions Tell Us "This Is Identifiable"
Comparing the two distributions, identification feasibility comes down to how much "separation" exists between them.
Pattern 1: Cleanly Separated (Ideal)
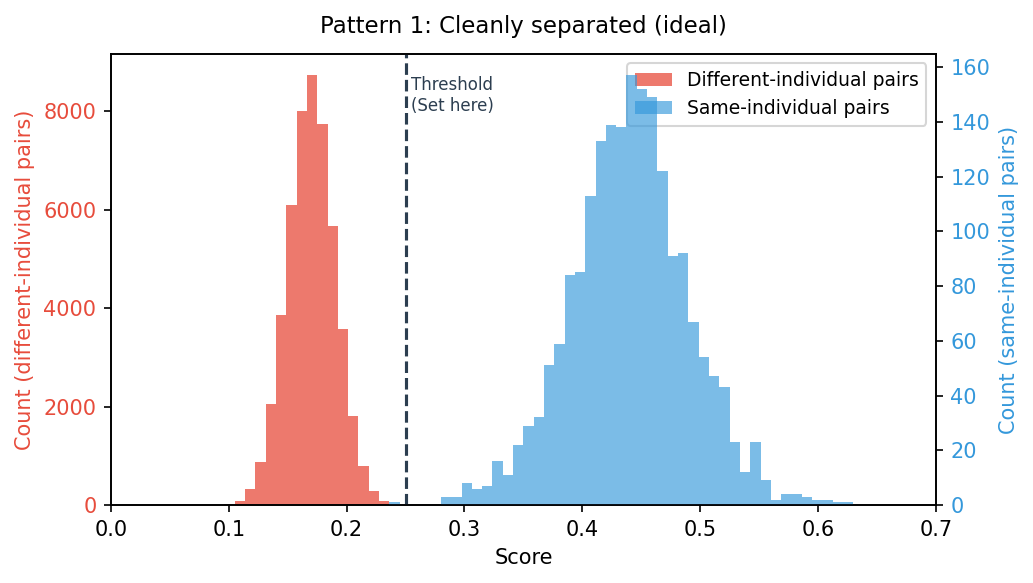
The different-individual-pair distribution and the same-individual-pair distribution are completely separate, with a score range of empty space between them. Place the threshold anywhere in that gap, and same-individual and different-individual pairs are reliably distinguished. This is what an identifiable target looks like. The wider that empty range is across your verification samples, the more robust the system is to imaging variation in production, and the higher your confidence.
Pattern 2: Slight Overlap
The two distributions are mostly separate, but they overlap in a narrow score range. In that overlap, misjudgments are guaranteed to occur:
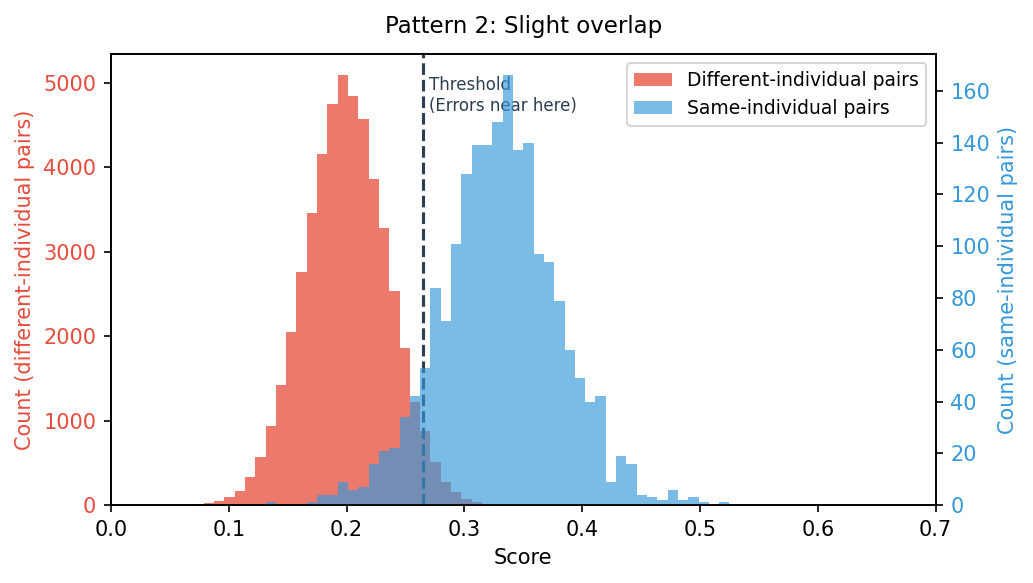
- A different-individual pair may be judged as same-individual (false match)
- A same-individual pair may be judged as different-individual (missed match)
If the overlap is small enough, you can still operate the system by treating the misjudgment rate as an acceptable cost. The decision comes down to the precision your application requires versus the business risk of an error.
Pattern 3: Heavy Overlap
The two distributions overlap heavily, or are barely separated at all. Wherever you place the threshold, many misjudgments will occur, so the conclusion is: with this object and these imaging conditions, individual identification is not feasible.
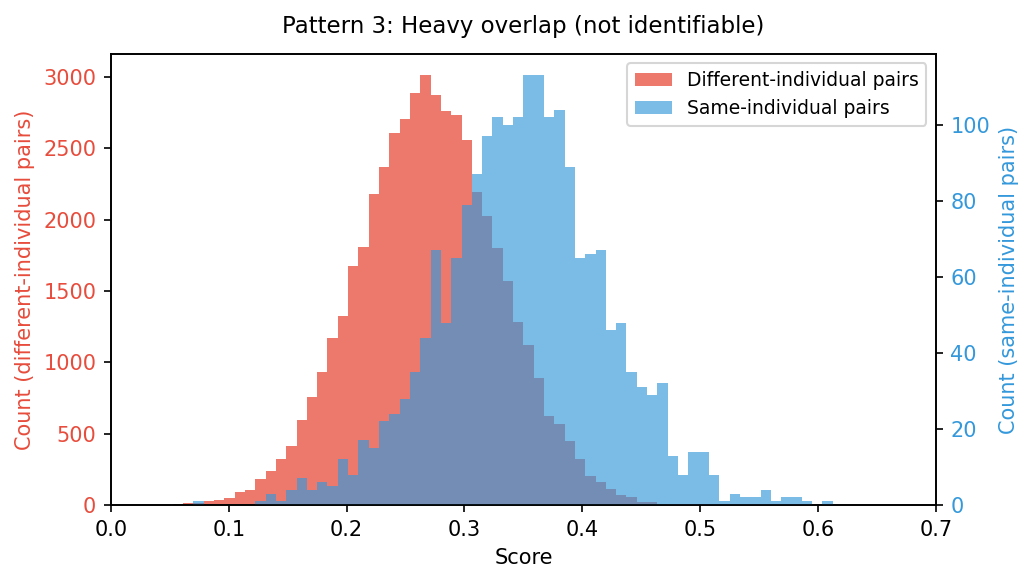
This isn't a dead end. You revisit the imaging conditions, change how you capture the images, and re-run the analysis. The work shifts to teasing apart "is the lack of separation due to the material itself, or due to the way we're imaging it?" In many cases, once you can capture the images "correctly" (which has its own challenges, of course), individual identification becomes feasible.
A Sense of Typical Score Ranges
For reference, in our experience at GAZIRU verifying various industrial product surfaces, scores tend to land in roughly the following ranges:
- Different-individual-pair scores: rarely exceed 0.2
- Same-individual-pair scores: distribute around 0.3 to 0.5
- The threshold you set: usually lands in the 0.2–0.25 range
For instance, a "0.35 from a same-individual pair" on a typical material is a perfectly healthy number — a score that strongly suggests identification will work. The reason is that on most materials it's hard for a different-individual pair to even reach a score around 0.25, so there's plenty of margin between the two distributions.
That said, these are only rough guides. The numbers shift with the object and with the imaging conditions. That's exactly why, before going into production, you must always take the distributions for your specific target and confirm.
Summary
In tagless individual identification, the question of whether identification is feasible:
- Is not decided by the absolute value of any one score
- Is decided by how cleanly the same-individual-pair and different-individual-pair distributions separate
And the right threshold is not pre-determined — it's derived from the distributions for your specific object.
So when someone asks "can tagless individual identification work for our product?", the most reliable answer is to run this distribution verification on actual samples of that product. When we at GAZIRU propose a Proof of Concept (PoC) to a customer, demonstrating exactly this kind of distribution is the goal we aim for — reaching it is what lets us say that individual identification is feasible.